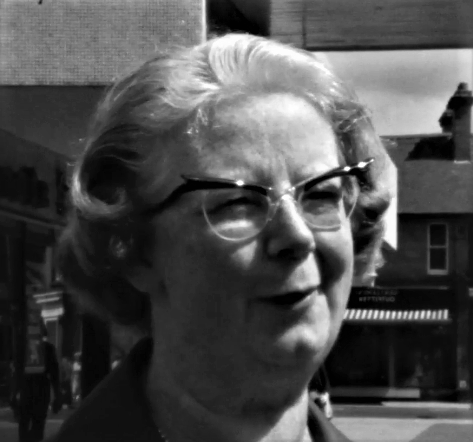
Abbey & Borrowell (3 seats)
| Candidate | Party | Votes |
| *Helen Bainbridge Dore | Liberal | 1986 |
| *Jack Bastock | Liberal | 1795 |
| Haydn Alan Thomas | Liberal | 1387 |
| *Kenneth William Hogarth | Conservative | 1340 |
| Ronald Stansfield | Conservative | 1245 |
| Nicholas Russell Wilson | Conservative | 1141 |
| Wendy Jane England | Labour | 474 |
| Susan Elizabeth O’Donovan | Labour | 322 |
| Collen Bernadette Ramsey | Labour | 259 |
Registered Voters 4287
Ballot Papers Issued 3474 (7 spoilt)
Votes Cast 9949 (81% Turnout)
Liberal gain from Conservative
Castle (2 seats)
| Candidate | Party | Votes |
| *Michael Francis Coker | Conservative | 1277 |
| *Kenneth Rawnsley | Conservative | 1199 |
| Leslie Graham Windybank | Liberal | 699 |
| David Arthur Preece | Liberal | 681 |
| Thomas Swallow | Labour | 166 |
| Gordon Herbert Mitchell | Labour | 161 |
Registered Voters 2765
Ballot Papers Issued 2271 (16 spoilt)
Votes Cast 4183 (82.1% Turnout)
No Change
Park Hill (2 seats)
| Candidate | Party | Votes |
| Robert Charles Butler | Liberal | 1080 |
| Spencer Charlton Harrison | Conservative | 968 |
| Kenneth Bulmer | Conservative | 922 |
| Kenneth Charles Evans | Liberal | 869 |
| Peter Rhydwen Jones | Labour | 249 |
| Peter Frederick Singer | Labour | 222 |
Registered Voters 2684
Ballot Papers Issued 2237 (1 spoilt)
Votes Cast 4310 (83.3% Turnout)
Liberal gain from Conservative
St John’s (2 seats)
| Candidate | Party | Votes |
| *William Henry Wozencroft | Labour | 790 |
| *Richard Ernest Monnington | Conservative | 710 |
| Robert Ronald Wooller | Conservative | 678 |
| Malcolm Leslie Burfitt | Labour | 566 |
| Mary Muirhead Archer | Liberal | 377 |
| Leonard Charles Davis | Liberal | 354 |
Registered Voters 2241
Ballot Papers Issued 1816 (2 spoilt)
Votes Cast 3475 (81% Turnout)
No Change
Windy Arbour (2 seats)
| Candidate | Party | Votes |
| *John Pearson Wilson | Conservative | 1381 |
| James Herbert Whitby | Conservative | 1282 |
| Lynn Annette Pollard | Liberal | 601 |
| Stephen James Francis Adams | Liberal | 524 |
| Joseph William England | Labour | 213 |
| Elizabeth Evelyn Lee | Labour | 176 |
Registered Voters 2609
Ballot Papers Issued 2194 (10 spoilt)
Votes Cast 4177 (84.1% Turnout)
No Change
MASSIVE TURNOUT BY KENILWORTH VOTERS
Not for many years has a Kenilworth election produced such a large turnout of voters. But as it was the same day as the General Election, so it wasn’t surprising. Every ward produced more that 80%, un-heard of in local elections. In the event, the Liberals gained two seats from the Tories, much to everyones surprise. The lone Labour voice is Bill Wozencroft, who retained his seat by topped the poll at St John’s with 790 votes.

Liberal, Helen Dore received the highest vote in the election, 1,986 in Abbey & Borrowell.
Four Conservatives who seeked re-election retained their seats. One surprise return to the Tory ranks was James Whitby. He was first elected in Kenilworth in 1964, during the days of the old KUDC but did not seek re-election in the 1967 poll. The Tories also saw the return of Spencer Harrision, another veteran of the old council.
In Kenilworth, the Tories took 46.6% of votes cast, Liberals 39.7% and Labour 13.5%.
WDC Standings (58 seats)
40 Conservative Party
13 Labour Party
4 Liberal Party
1 Ratepayers of Whitnash
22 SEAT OVERALL MAJORITY
Kenilworth District Councillors
6 Conservatives (J. Pearson, J. Whitby, R. Monnington, S. Harrison, M. Coker, K. Rawnsley)
4 Liberals (R. Butler, H. Dore, J. Bastock, H. Thomas)
1 Labour (B. Wozencroft)