Abbey & Arden (3 seats)
| Candidate | Party | Votes | Share % |
| David John Armstrong | Green | 1597 | 16.85 |
| Kyn Aizlewood | Green | 1535 | 16.20 |
| *Richard John Hales | Conservative | 1292 | 13.63 |
| John Watson | Green | 1275 | 13.45 |
| *John Anthony Cooke | Conservative | 1262 | 13.32 |
| Janet Elizabeth Sara Gee | Conservative | 1230 | 12.98 |
| Annabella Mia Gurney-Terry | Lib-Dems | 349 | 3.68 |
| Ederyn Williams | Lib-Dems | 345 | 3.64 |
| Hannah Deacon | Labour | 307 | 3.24 |
| Timothy Edward Gordon Macy | Conservative | 285 | 3.01 |
Registered Voters 8,411
Ballot Papers Issued 3.322 (14 spoilt)
Votes Cast 9,477 (39.5% turnout)
Park Hill (3 seats)
| Candidate | Party | Votes | Share % |
| *Alistair James Kennedy | Green | 1838 | 20.01 |
| Lara Louise Cron | Green | 1585 | 17.26 |
| Lowell Charles Williams | Green | 1333 | 14.51 |
| Malcom Graham | Conservative | 1066 | 11.61 |
| Felicity Gena Bunker | Conservative | 971 | 10.57 |
| Frances Lasok | Conservative | 846 | 9.21 |
| Jeremy Eastaugh | Labour | 491 | 5.34 |
| Adrian George Marsh | Lib-Dems | 436 | 4.75 |
| Alan Gordon Chalmers | Lib-Dems | 404 | 4.40 |
| Silva Fuchss | Lib-Dems | 214 | 2.33 |
Registered Voters 7,767
Ballot Papers Issued 3,232 (9 spoilt)
Votes Cast 9,184 (41.6% turnout)
St. John’s (3 seats)
| Candidate | Party | Votes | Share % |
| *Katherine Sara Dickson | Lib-Dems | 1948 | 19.96 |
| *Richard Guy Dickson | Lib-Dems | 1826 | 18.71 |
| *Andrew William Milton | Lib-Dems | 1473 | 15.09 |
| Richard Spencer | Conservative | 1166 | 11.95 |
| Joe Rukin | Green | 972 | 9.96 |
| Andy Metcalf | Conservative | 956 | 9.80 |
| Isabella Moore | Conservative | 886 | 9.08 |
| Peter Sheils | Labour | 532 | 5.45 |
Registered Voters 7,730
Ballot Papers Issued 3,586 (20 spoilt)
Votes Cast 9,755 (46.4% turnout)
ALL CHANGE AT THE DISTRICT
For the past four years the Tories had been leading a minority administration, along with the Whitnash Residents Association. But in this election, they lost 10 seats, and were left with only six councillors.
In Kenilworth, the Lib-Dems easily retained their three seats in St. John’s. In the other two wards, five seats went to the Greens, which included four new faces. The remaining seat went to surviving Tory member, Richard Hales, who retained his seat in Abbey & Arden by just 17 votes. John Cooke, lost his seat in the same ward, which he had held for the last eight years.
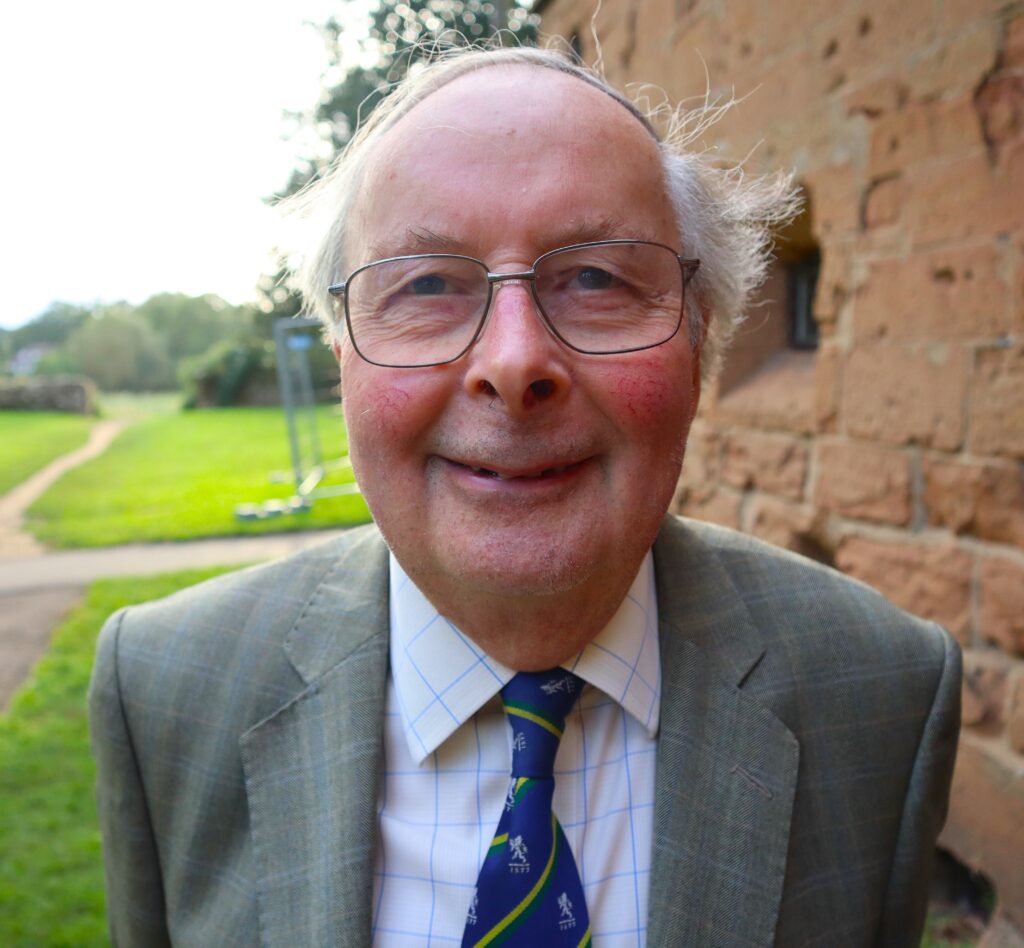
Tory, George Illingworth (pictured) who was first elected to the WDC in 2007, did not seek re-election this year due to retirement from local government. He was elected chairman in 2019/20.
The Greens are Growing
The Greens were the biggest winners, gaining 6 seats to become the largest party with 14 members, but no overall control. So the parties had to come to an agreement that would suit everyone.
Voter ID Arrives – with success
99.95% of electors who came to vote in Warwick District Council polling stations brought photo ID, which met the newly introduced voter ID requirements.
Figures across the district shows that 28,432 electors voted at 126 polling stations. 106 electors that were initially turned away, 92 returned with a valid ID and voted. But 14 electors (0.05%) did not return. This means 86.79% of those initially turned away returned later in the day and voted.
WDC Standings (44 seats)
14 Green Party
11 Labour Party
10 Liberal Democrats
6 Conservative Party
3 Whitnash Residents Association
No overall control
Kenilworth District Councillors
5 Greens (D. Armstrong, K. Aizlewood, A. Kennedy, L. Cron, L. Williams)
3 Lib-Dems (K. Dickson, R. Dickson, A. Milton)
1 Conservative (R. Hales)